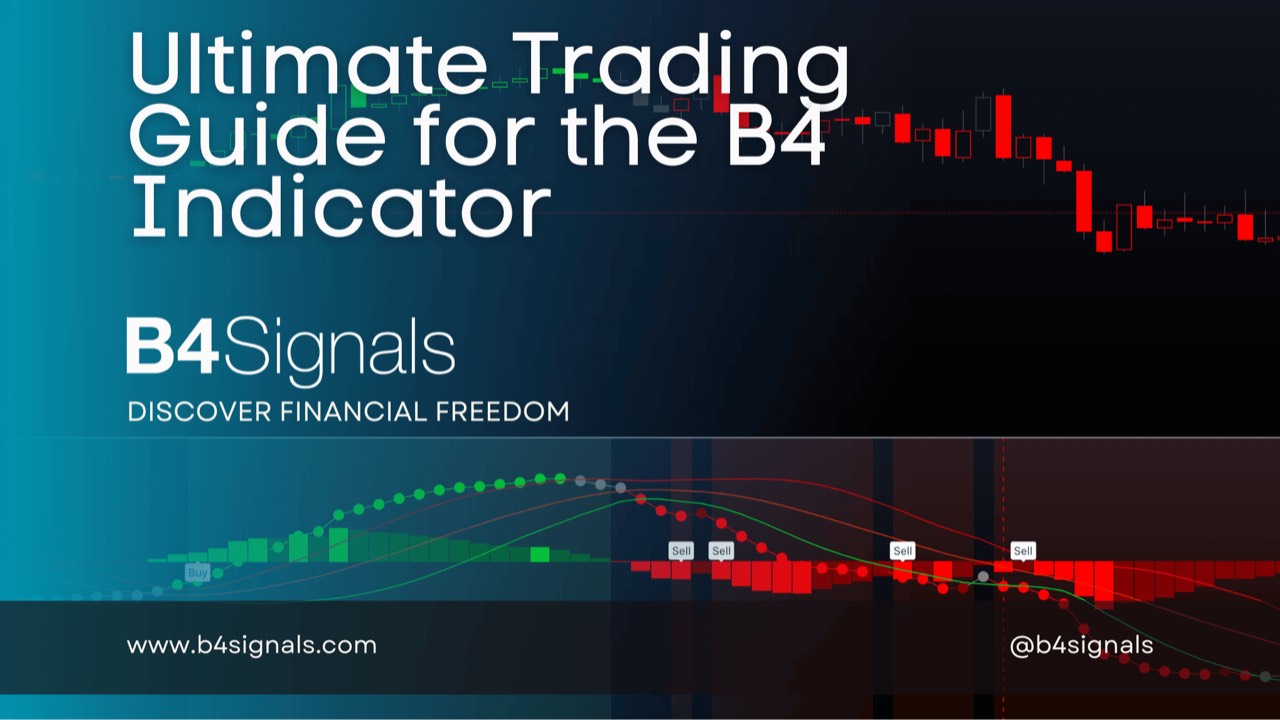
Ultimate Trading Guide for the B4 Indicator
Nov 08, 2023
Welcome to the Ultimate Trading Guide for the B4 Indicator, your gateway to optimizing your trading strategy and unlocking the potential for success in the financial markets. Whether you're a seasoned trader looking to fine-tune your approach or a beginner venturing into the world of trading, this comprehensive guide will equip you with the knowledge and strategies to leverage the B4 Indicator effectively. Let's embark on this journey to elevate your trading game and discover the power of the B4 Indicator.
- Emphasize trading in alignment with the B4 Midline direction. The synchronized trend label and B4 Trend Line indicate the correct trading direction when in agreement.
- Enhance confirmation using Divergence analysis.
- Exercise caution during neutral trends, as they tend to result in unprofitable choppiness.
- Our updated squeeze logic now incorporates Squeeze dots on the Zero Line and labels to signal squeeze conditions. To anticipate breakouts, consider drawing a chart wedge pattern upon sighting these indicators. Additionally, a yellow (default) Trend Cloud appears on the Trading Bands (if enabled in settings In some versions) when this condition is met. Breakouts often follow a squeeze, providing an opportune entry point. For insight into potential breakout direction, you can acquire our B4 Squeeze Indicator.
- Constricted Trading Bands indicate consolidation or equilibrium zones. Such levels often act as support and resistance areas. When the Trading Band is tightly constricted and the B4 Trend Line crosses above the Upper Band, a strong upward movement is typical. Conversely, when the Trading Band is tightly constricted and the B4 Trend Line crosses below the Lower Band, expect a downward move. Note the Histogram color for optimal results.
- Widened Trading Bands with the Trend Line approaching indicate potential overbought or oversold conditions.
- The default alerts for Trading Band crossovers from both directions are set to the Midline for a cautious entry or exit points.
- Aggressive traders may opt to enter a position when the B4 Trend Line crosses the Upper or Lower Bands. This method might not pinpoint exact tops or bottoms but provides valuable price trend information.
- The backdrop of B4 Trend Clouds offers supplementary confirmation. In confluence, the signals are either red or green by default. Discordance suggests turbulence or shifts in investor sentiment. (In some versions, these may be deactivated by default.)
- Initially, monitor the B4 Trend Line for the first trade confirmation. Often, it shifts from red to dark red or green to dark green. This serves as a primary guide when using the indicator.
- When the B4 Trend Line turns gray, it indicates indecision. Afterward, seek secondary confirmation upon its Midline crossover for entry or exit decisions. Apply this approach for both entries and exits (useful for refining exit strategies).
- Lower risk-tolerant traders should consider scaling out or exiting positions when the B4 Trend Line turns gray or transitions from green to dark green or from red to dark red, especially upon crossing the upper or lower bands.
- A recommended practice involves zooming in the lower indicator to occupy the entire screen, obscuring the candles. Then, draw vertical lines to identify swing highs and lows. Upon returning to a standard chart view, the indicator's impressive accuracy becomes evident.
- Pay close attention to the Histogram; a dark green or dark red reading alongside candle reversals signals potential pullbacks or future reversals. Tightening stop-loss orders upon such observations can be prudent, especially when aiming to secure profits.
- Remember that a dark green Histogram suggests bearishness, while a dark red indicates bullish sentiment.
- If you received a prior buy or sell signal and the Histogram has subsequently shifted to dark green for long positions or dark red for short positions, your position within that trend remains intact until a contrasting buy or sell signal emerges. Should the Histogram's momentum increase, it indicates a continuation of the trend, which should be confirmed by another buy or sell signal.
Trading involves risk, and past performance is not indicative of future results. The B4 Indicator is a powerful tool, but it is essential to exercise caution and proper risk management in your trading activities. Make informed decisions and be aware of the risks involved. Consult with a financial advisor if necessary. Your success in trading ultimately depends on your knowledge and prudent trading practices
SUBSCRIBE FOR WEEKLY LIFE LESSONS
Lorem ipsum dolor sit amet, metus at rhoncus dapibus, habitasse vitae cubilia odio sed.
We hate SPAM. We will never sell your information, for any reason.

